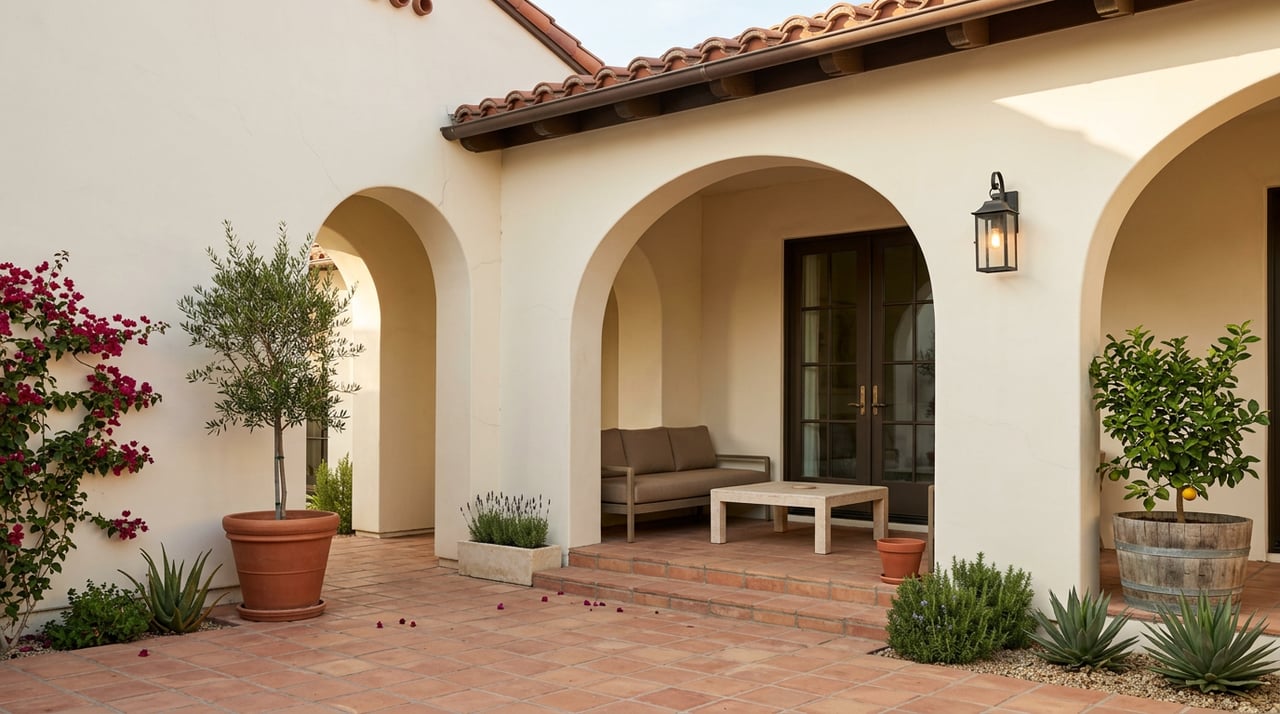
Looking for a clear, no‑nonsense read on Sierra Madre real estate right now? You are not alone. With only a few dozen homes on the market at any time, the numbers can feel confusing and they change fast. In this snapshot, you will see current price ranges, pace, and what it all means for you as a buyer or seller in 2026. Let’s dive in.
Sierra Madre market snapshot 2026
Sierra Madre is a small foothill city with roughly 11,000 residents, which means a few sales can swing monthly stats. It helps to look at 12‑month trends and active listings side by side.
- Typical price band: Many single‑family homes cluster around 1.3M to 1.7M based on multi‑source views over the last 12 months.
- Median list price: About 1.65M to 1.70M for current active listings in ZIP 91024.
- Sold medians: Several 12‑month sold views hover around the mid‑1.4M range. The gap versus list prices is normal in a small market skewed to newer or higher‑end listings.
- Price per square foot: Often in the 700 to 760 dollars per sq. ft. range, with renovated or view properties higher.
- Days on market: Commonly 44 to 87 days depending on the source and timeframe. Expect weeks to a few months on the market for many homes.
- Inventory: Approximately 30 to 46 active listings at a time. That is a small pool and helps explain price stability alongside local volatility.
- Sale‑to‑list ratio: Near 100% in several reports, so accurate pricing is key.
Tip: With only a handful of closings in some months, short‑term medians can dip or spike. Use year‑to‑date or 12‑month windows for a steadier picture.
Why prices look the way they do
Sierra Madre blends a walkable village core, foothill trails, and a small‑town feel. With a population near 11,268, it has limited housing stock and steady demand from buyers who want proximity to Pasadena and the San Gabriel Mountains. That supply‑demand balance helps support prices above many broader Los Angeles averages. For a quick city snapshot, see U.S. Census QuickFacts for Sierra Madre.
Regional forces to watch
Prices here also move with regional affordability and mortgage rates. California’s January 2026 report showed a mixed picture by metro, with many coastal areas still expensive even as statewide medians softened to start the year. You can skim the California Association of REALTORS January 2026 release for statewide context.
Mortgage rates remain a major lever on buying power. In early March 2026, the 30‑year fixed hovered near the 6 percent area, according to the Freddie Mac PMMS archives. On Sierra Madre price points, small rate moves can change monthly payments a lot, so update your pre‑approval often.
Insurance and wildfire
Sierra Madre sits on the San Gabriel foothills, and insurance availability has been a topic across LA County foothill communities. A past insurance moratorium followed the Bobcat Fire, as reported by the Los Angeles Times. State leaders continue to discuss solutions, including proposed legislation that would require insurers to write and renew policies for properties that meet fire‑safe standards. You can read the summary on the California Senate District 25 site.
What this means for you: confirm insurability early, especially for hillside or canyon locations. Ask about recent claims, mitigation features, and whether a standard homeowner policy or the FAIR Plan applies.
Taxes and carrying costs
Under Proposition 13, Los Angeles County property tax bills reflect a base rate plus local assessments. Effective rates commonly fall in the 0.7 to 1.25 percent range depending on the parcel. You can review county context on ATTOM’s Los Angeles County property navigator. Always verify the specific Tax Rate Area and recent bill for the property you are considering.
If you are buying
In a small market, speed and clarity matter. Here is how to compete without overreaching:
- Get fully pre‑approved, not just pre‑qualified. Update your rate quote weekly in a changing market. The Freddie Mac PMMS is a helpful context check.
- Track new listings daily. Inventory often sits near a few dozen homes, and well‑priced properties can draw quick interest.
- Use price‑per‑sq‑ft comps for the immediate micro‑area. Citywide medians can mislead when a few larger estates trade.
- Budget for total monthly costs. Include mortgage, taxes, insurance, and utilities. If fire risk applies, price the policy options before you write the offer.
- Confirm insurability up front. Ask your lender and insurance broker to run quotes early, and review any mitigation credits. The CA SD25 insurance summary is a good primer on the direction of policy discussions.
- Understand school context neutrally. Many buyers research nearby campuses and commute patterns. For a starting point, see the city’s schools and district links. Always verify program details directly with the district.
What to expect on pricing: competitive interest on well‑priced smaller homes, and more negotiation room or longer marketing times on larger, unique, or hillside properties. Sale‑to‑list ratios near 100 percent reward realistic offers.
If you are selling
Sellers have a real opportunity when they pair smart pricing with strong presentation:
- Price to the present. Active listing medians around the high‑1.6M range sit above many 12‑month sold medians. Accurate, data‑backed pricing helps you attract early showings and reduce days on market.
- Focus on first impressions. Professional photos, clear disclosures, and thoughtful staging set the tone. Share insurance and maintenance history to build buyer confidence.
- Market to real demand. Highlight lifestyle features that resonate locally, such as proximity to hiking, the village core, and convenient connections to Pasadena.
- Time your launch. Spring often brings more buyer traffic in our region, but success depends more on preparation, pricing, and access than on the specific week you list.
- Use local comps. In a small city, one nearby sale can be more relevant than five across town. Pay close attention to square footage, lot, condition, and hillside location.
With sale‑to‑list ratios near par in aggregate, sellers who price in line with the market and present well often see efficient results.
Recent closed sales to benchmark
These public‑record examples illustrate the range you may see in Sierra Madre. Always treat them as historical reference, not price guarantees.
- 1935 Stonehouse Rd — sold for 5.85M on May 28, 2025 (public records via major listing portals). Large hillside estate example.
- 556 Camillo Rd — sold for 2.825M in 2025 (public records via major listing portals). Higher‑tier detached home.
- 249 Grove St — sold for 1.875M on May 16, 2025 (public records via major listing portals). Representative move‑up home.
- 640 Chaparral Rd — sold for 1.56M on Jan 27, 2026 (public records via major listing portals). Typical single‑family sale in early 2026.
- 305 E Laurel Ave — sold for 1.40M on Mar 4, 2026 (public records via major listing portals). Active mid‑1.3M to mid‑1.6M band.
- 238 Auburn Ave — sold for 960K on Jan 2, 2026 (public records via major listing portals). Occasional sub‑1M closing for smaller or older homes.
How to read the numbers
- Listing vs. sold medians: Active listings tilt higher than 12‑month sold medians. That is normal, especially when more high‑end or newly renovated homes hit the market at once.
- Monthly swings: With just a handful of sales in some months, one unusually low or high closing can shift a median. Use year‑over‑year or rolling 12‑month views for big decisions.
- Price per square foot: The 700 to 760 dollars per sq. ft. citywide range is a starting point. For pricing and offers, use hyper‑local comps that match your home’s size, lot, condition, and setting.
- Pace and strategy: Days on market in the several‑weeks to few‑months range reward clean pricing on day one. Buyers should allow time for due diligence, appraisal, and insurance underwriting.
Work with a local advisor
You deserve clear guidance, solid comps, and a plan tailored to your goals. With 35 years serving the San Gabriel Valley, I help you read the data, time your move, and market or negotiate with confidence. If you are weighing a purchase or sale in Sierra Madre, let’s talk through your options and build a step‑by‑step plan.
Ready to get started? Schedule a free market consultation with Patricia Parish.
FAQs
What are typical home prices in Sierra Madre in 2026?
- Most single‑family homes cluster roughly between 1.3M and 1.7M, with active listings often near the high‑1.6M range and some higher‑end hillside properties selling above that.
How fast are homes selling in Sierra Madre right now?
- Several market trackers show median days on market in the 44 to 87 day range, so plan for weeks to a few months depending on price, condition, and location.
What price per square foot should I expect?
- A working benchmark is about 700 to 760 dollars per sq. ft., with renovated, view, or luxury properties higher and larger, older homes often lower.
How much inventory does Sierra Madre usually have?
- Inventory is small, commonly around 30 to 46 active listings at a time, which supports price stability and also leads to month‑to‑month volatility in the stats.
How do insurance and wildfire risk affect buying here?
- Confirm insurability early, especially for foothill homes. Review coverage options, mitigation features, and the potential need for the FAIR Plan. You can read about past moratoria in the Los Angeles Times coverage of the Bobcat Fire and ongoing policy ideas on the CA SD25 site.
What should I budget for property taxes in Los Angeles County?
- Effective rates often land between 0.7 and 1.25 percent depending on parcel and assessments. Always verify the specific Tax Rate Area and recent bill, and see ATTOM’s county overview for context.